- Despite recent pricing issues, SHIB's long-term outlook remains bullish
- The main on-chain SHIB indicator also issued a buy signal
According to the main technical indicators observed on the weekly chart, the leading memecoin is Shiba Inu [SHIB] Poised for a longer-term rally, despite recent price woes.
At the time of writing, the value of the altcoin is $0.000025. according to CoinMarketCapits value fell by 20% in just over a month.
SHIB prepares for take-off
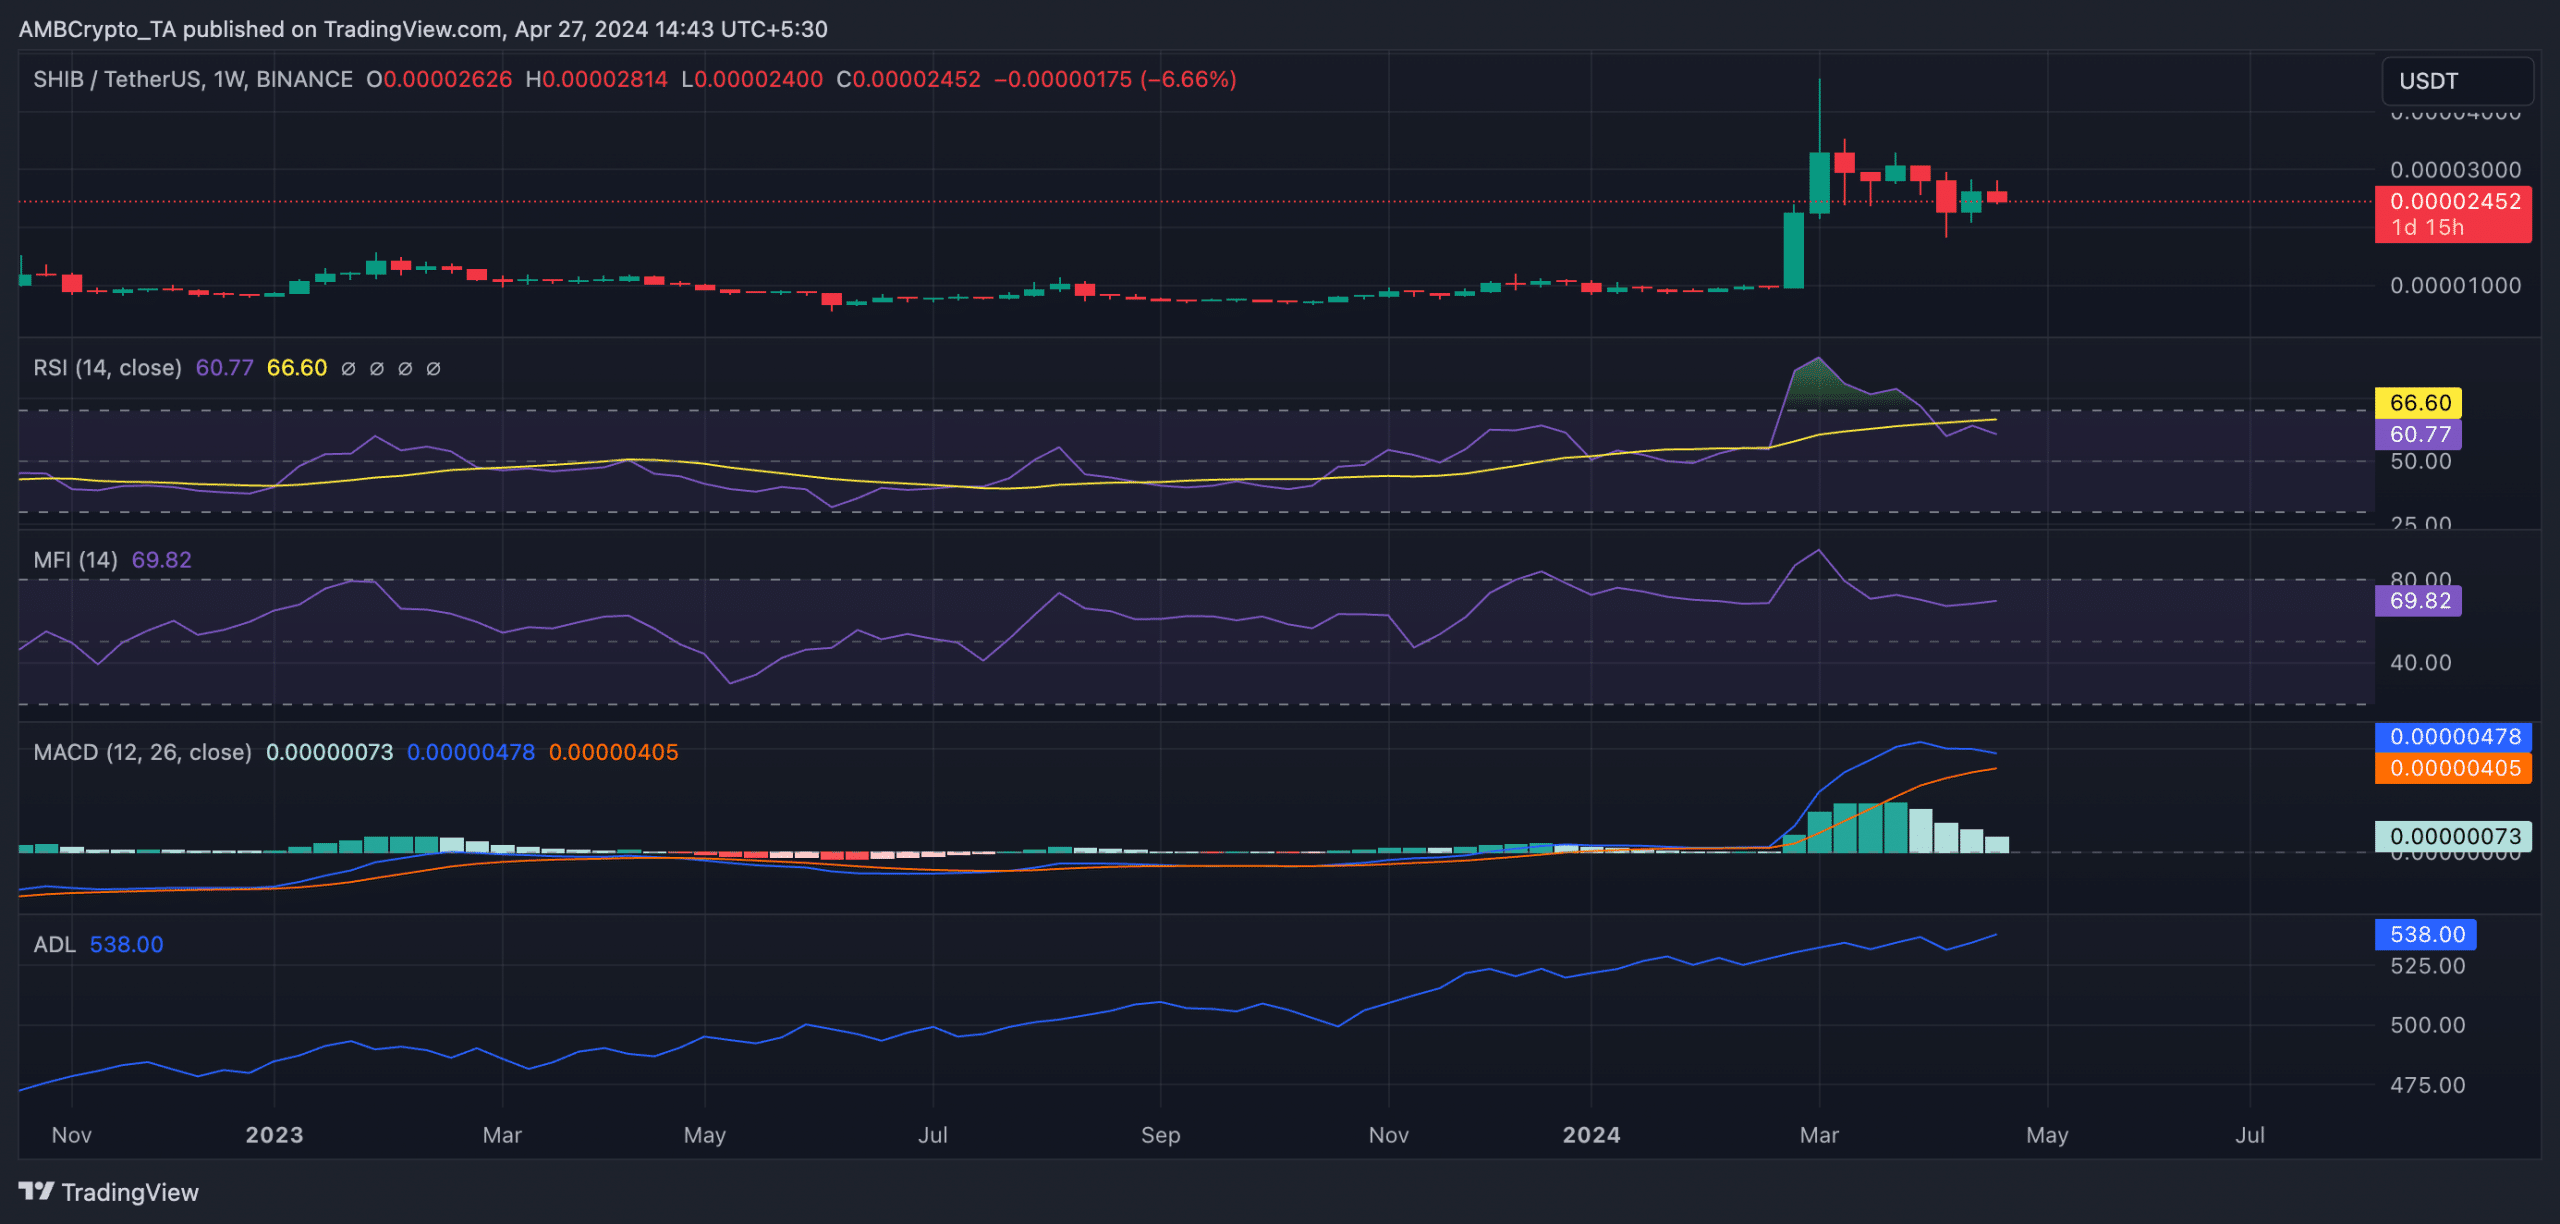
The first indicator worth noting here is SHIB's Moving Average Convergence/Divergence (MACD), which tracks market trends and changes in price momentum. At press time, the currency's MACD line (blue) is above the signal line (orange).
This is considered a bullish signal, and traders often interpret it as a signal to open long positions and exit short positions.
Also, despite recent price issues, SHIB's momentum indicators highlighted continued demand for memecoin. The Relative Strength Index (RSI) reached 60.77, while the Money Flow Index (MFI) read 69.82. At these values, these indicators indicate that SHIB traders prefer to accumulate currency rather than distribute it.
Confirming market participants' preference for SHIB accumulation, the Accumulation/Distribution Line (A/D Line) was also in an uptrend, at press time.
This indicator measures the cumulative flow of money into or out of an asset during a specific period. When it rises this way, it indicates that more money is flowing into the asset due to higher buying pressure. By doing so, it confirms the possibility of the price rising on the charts.
Source: XRP/USDT on TradingView
SHIB whales are unaffected by the losses
Despite the double-digit memecoin price drop over the past month, SHIB whales holding between 100 and 1,000,000 SHIB coins have intensified their accumulation practices.
In fact, at press time, this group of investors totaled 299,000, with their numbers up 4% in the last 30 days, according to Santiment Data.
These memcoin holders have also remained resilient, although daily transactions involving SHIB continue to incur losses. According to Santiment, the daily profit-to-loss ratio of SHIB's transaction volume was 0.359.
Simply put, this means that for every SHIB transaction that resulted in a loss, only 0.359 transactions ended in profit.
Is your wallet green? Check out SHIB's earnings calculator
Now may be a good time to buy
Finally, on-chain data revealed that SHIB's Market Value to Realized Value (MVRV) ratio gave a buy signal. According to SantimentSHIB's MVRV ratios on the 30-day and 365-day moving averages were -132% and -147%, respectively, at the time of writing.

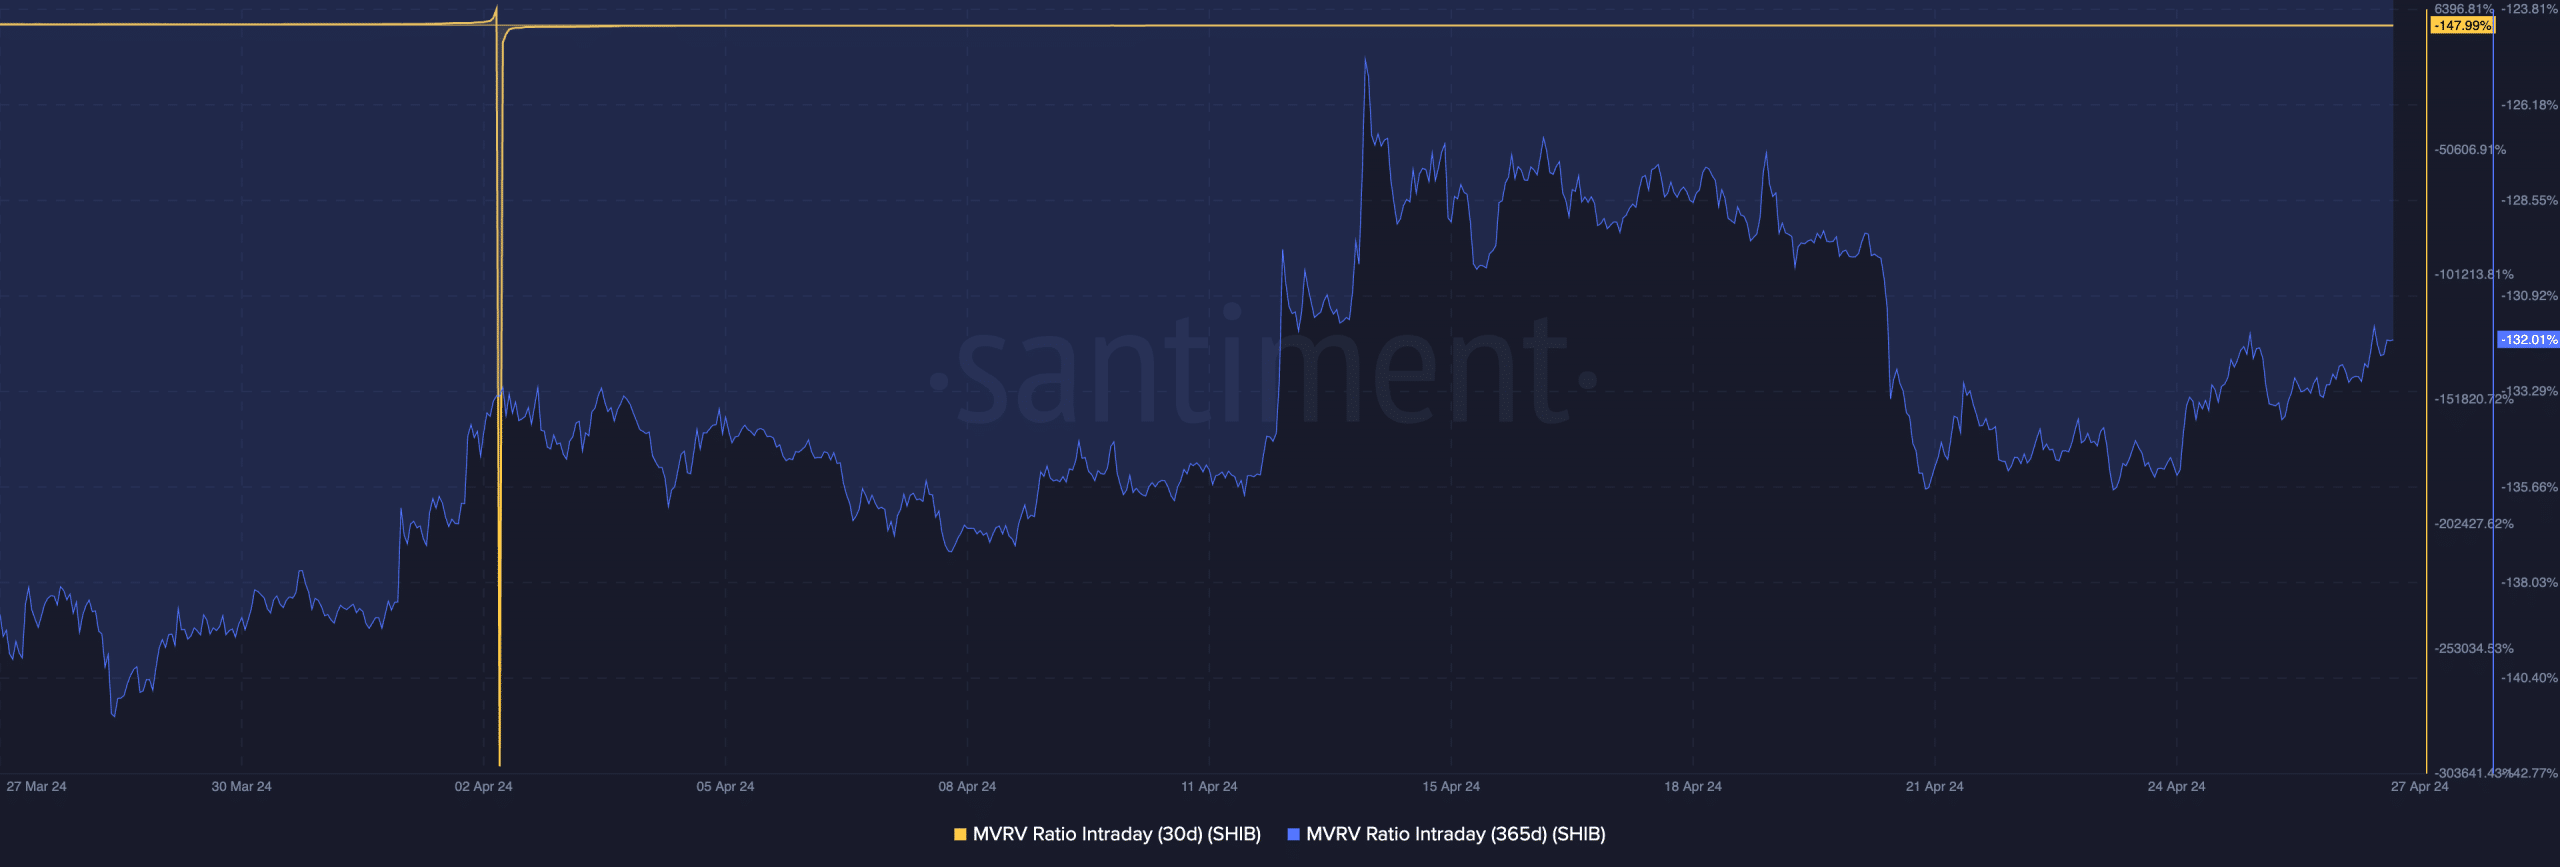
Source: Santiment
The MVRV ratio tracks the ratio between the current market price of an asset and the average price of each coin or token acquired for that asset.
When it is negative in this way, the asset in question is said to be undervalued. This means that the market value of the asset is less than the average purchase price of all the tokens in circulation, which many consider to be a good buying opportunity.

“Devoted student. Bacon advocate. Beer scholar. Troublemaker. Falls down a lot. Typical coffee enthusiast.”